If your research team is still exporting spreadsheets, merging vendor reports manually, and finding out about a data quality problem two weeks into fieldwork, you're not just losing time — you're losing the ability to fix problems while they still matter. Here's why real-time dashboards have become non-negotiable for research agencies in 2026.
For years, market research operations ran on a fairly standard rhythm: launch a study, let it run, pull the data at the end, then analyze what happened. That rhythm made sense when reporting cycles were slower and clients expected results in weeks, not days. It doesn't hold up anymore. Clients want faster turnarounds, vendors need to be managed across multiple concurrent projects, and data quality issues that go unnoticed for even a few days can quietly compromise an entire study.
This post covers what a real-time market research dashboard actually does, why "checking in at the end" is no longer good enough, and what agencies should look for when evaluating one.
The Problem With End-of-Project Reporting
Traditional research workflows typically only surface problems after fieldwork closes — at which point the damage is already done. A few common scenarios play out repeatedly across agencies without real-time visibility:
- A vendor's response quality drops midway through the field period, but nobody notices until final data cleaning, by which point hundreds of bad completes have already been collected
- Quota fill rates lag behind schedule for one demographic segment, and the team only discovers it when the project is already past deadline
- Duplicate or fraudulent respondents slip through because quality checks only run once, at the end, instead of continuously
- A client asks for a status update mid-project, and the team has to manually assemble numbers from three different vendor portals and a spreadsheet
Each of these is a fixable problem — if it's caught while the project is still running. Without real-time visibility, agencies are managing studies mostly in the dark until it's too late to course-correct.
What Real-Time Dashboards Actually Solve
A real-time dashboard isn't just a nicer-looking version of an end-of-project report. It changes what's operationally possible during a live study.
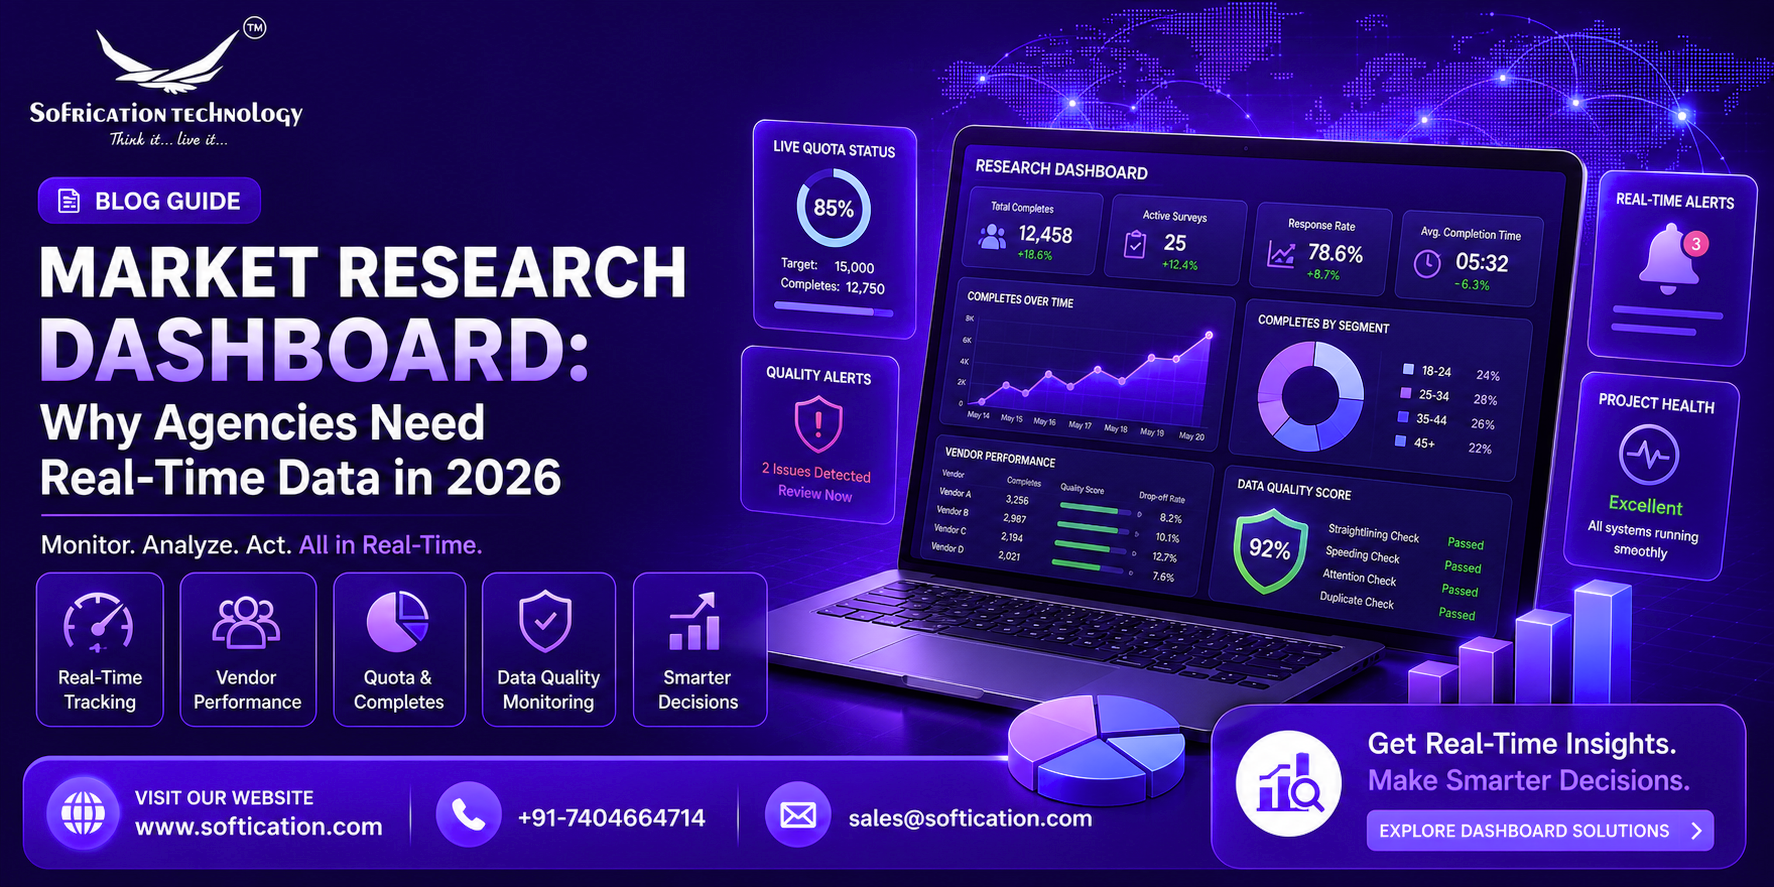
1. Live quota and completion tracking Instead of waiting for a scheduled export, project managers can see exactly how many completes have come in, by segment, at any moment — making it obvious early if a demographic quota is falling behind pace.
2. Vendor performance visibility during field, not after Real-time dashboards can surface vendor-level quality signals (completion time, drop-off rate, flagged responses) as they happen, so a struggling vendor can be paused or reallocated mid-project instead of after the data's already compromised.
3. Centralized view across multiple concurrent projects Agencies running several studies at once benefit enormously from a single dashboard view instead of toggling between vendor portals, spreadsheets, and email updates for each project separately.
4. Faster client communication When a client asks "how's the project going," a live dashboard means the answer is a shared link, not a scramble to compile numbers from multiple sources.
5. Early fraud and quality flagging Combined with proper respondent auditing, real-time dashboards make it possible to catch quality issues — like the sample fraud patterns increasingly common in 2026 — while the study is still running, rather than discovering them during final data cleaning.
Why "Real-Time" Matters More in 2026 Specifically
A few shifts in the industry have made real-time visibility less of a nice-to-have and more of a baseline expectation:
- Field periods have compressed. Clients increasingly expect faster turnarounds, which leaves far less margin for catching and fixing problems after the fact.
- Fraud detection has gotten more complex, as covered in our recent post on sample fraud warning signs — and catching it early requires monitoring throughout the field period, not just a final review.
- Agencies are managing more vendors simultaneously, often across geographies, which makes manual cross-vendor comparison genuinely difficult without a centralized view.
- Clients themselves increasingly expect dashboard access, rather than waiting for scheduled status updates — agencies that can offer this stand out competitively.
What to Look for in a Research Dashboard
Not all "dashboards" are actually real-time, and not all real-time data is useful without the right structure around it. When evaluating a platform, look for:
- True live updates, not batch refreshes every few hours — the value of real-time data depends on how current it actually is
- Vendor-level breakdowns, not just aggregate project numbers, so quality issues can be traced to their source
- Respondent-level audit trails feeding into the same view, so quality and fraud signals aren't a separate system to check
- Quota and segment tracking that updates live, rather than requiring a manual pull
- Exportable, shareable views for clients, so status updates don't require a separate reporting step
- Historical comparison, so current project performance can be benchmarked against past studies with the same vendors
A dashboard that only shows a single project's current numbers, with no vendor history or fraud signals layered in, solves part of the problem but not the operational one that actually costs agencies time and quality.
The Bottom Line
The agencies losing the most time in 2026 aren't the ones without data — they're the ones with data that only becomes visible after it's too late to act on it. Real-time dashboards don't just make reporting look more polished; they change whether a struggling vendor, a lagging quota, or a fraud pattern gets caught during the project or discovered after the client already has the (compromised) results in hand.
FAQ: Real-Time Market Research Dashboards
What is a real-time market research dashboard? It's a live view of an active study's data — completion rates, quota fill, vendor performance, and quality signals — updated continuously during fieldwork rather than compiled only at project close.
Why do research agencies need real-time data instead of end-of-project reports? Because problems like vendor quality drop-off, lagging quotas, or fraudulent respondents are far easier and cheaper to fix while a study is still running than after it has already closed and the data has gone to a client.
Can a real-time dashboard help catch survey fraud? Yes — when paired with proper respondent auditing, real-time monitoring surfaces suspicious patterns (unusual vendor clustering, timing anomalies, duplicate devices) during fieldwork instead of only during final data cleaning.
How is a real-time dashboard different from a regular reporting tool? A standard reporting tool typically compiles data on a schedule or at project close. A real-time dashboard reflects current, live data at any given moment, which allows teams to act on issues while the project is still active.
Do clients benefit from having dashboard access too? Increasingly, yes. Agencies that offer clients a live, shareable view of project status — rather than periodic manual updates — tend to stand out competitively and reduce the back-and-forth of status check-in requests.